
Property valuations
How to Understand House Values in Your Local Area
Local house price averages are useful context, but they can conceal major differences between streets and property types. To understand what a particular home might be worth, you need a smaller and more relevant set of evidence. This guide explains where to start and what to question.
This is an estimate from comparable sales, not a RICS or mortgage valuation, and not a survey.
A local average is a starting point, not your home's price
A news article says house prices in your district rose. An online chart reports the average price in your town. Your neighbour says the road has become much more expensive.
All three observations may contain useful information, but none tells you what a particular home is worth. Local property markets are made up of different homes, streets and buyer groups. The right task is to move from a broad picture to the specific alternatives that buyers will consider.
Choose a geography that reflects buyer choice
A postcode district can include town-centre flats, village houses and rural properties with land. An average across that area can shift simply because the mix of properties sold changes.
Start with the streets and neighbourhoods a likely buyer would compare. Think about school routes, transport, local amenities, setting and housing stock. The nearest house is not always the most useful comparable if it serves a different buyer.
For unusual or rural homes, the relevant comparison area may need to be wider. For a conventional terrace, transactions in a small cluster of similar streets may be more informative.
Separate price level from price movement
A market report might show a change in average sale price between two periods. That change can reflect the mix of properties sold rather than a like-for-like increase in every home's value.
For example, a month with more detached-house completions can produce a higher average than a month dominated by flats. It does not follow that each flat or detached house rose by the same amount.
The UK House Price Index provides wider market statistics using a methodology designed for tracking changes. It remains a broad indicator rather than an individual property valuation.
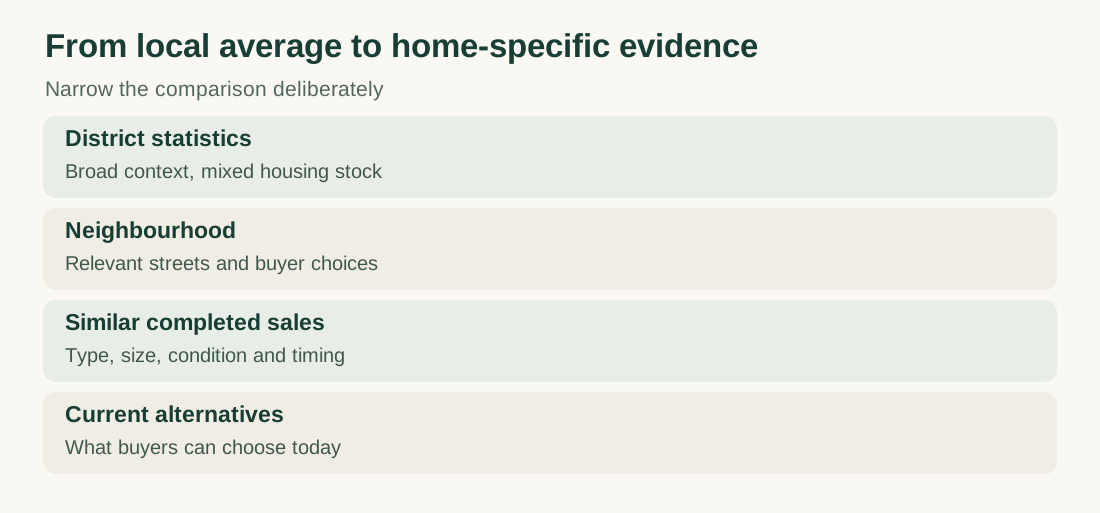
District statistics: Broad context, mixed housing stock. Neighbourhood: Relevant streets and buyer choices. Similar completed sales: Type, size, condition and timing. Current alternatives: What buyers can choose today.
Build a small, relevant evidence set
Look for recent completed sales of homes similar in type, approximate size, accommodation, condition and location. HM Land Registry's Price Paid Data records relevant completed transactions in England and Wales, but the published information has limitations and may lag completion.
Create a brief comparison record for each sale. What was sold? When? How does it differ from your home? Is there anything you cannot verify?
Do not exclude a lower sale merely because it is inconvenient. Equally, do not give an apparently nearby transaction full weight if the property is fundamentally different.
How to use sold house prices explains the practical process in more detail.
Check today's competition separately
Completed transactions provide historical evidence. Current listings show what buyers can choose from now, but their asking prices are not confirmed market outcomes.
Imagine a buyer with a fixed budget opening several listings in the same search. Would your home stand out for its layout, garden, condition or location? Or does a competing home offer similar accommodation for less?
Illustrative example. Two four-bedroom homes are listed at £600,000. One has been recently refurbished and sits within walking distance of a station. The other has a larger plot but needs substantial updating. The identical asking prices do not make the homes equivalent, and the eventual buyer pool may differ.
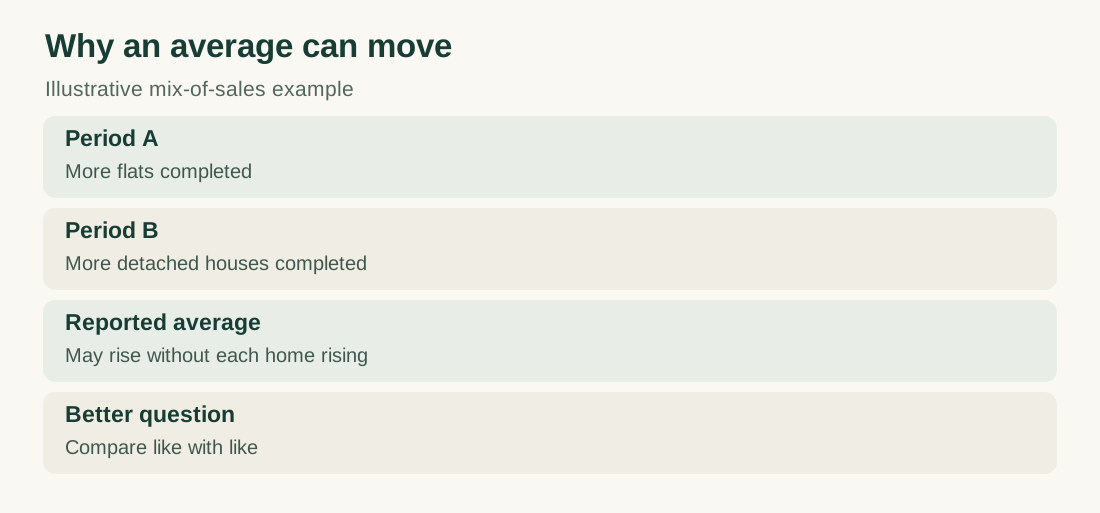 Illustrative example
Period A: More flats completed. Period B: More detached houses completed. Reported average: May rise without each home rising. Better question: Compare like with like.
Understand what a local statistic cannot reveal
Even a well-constructed local dataset may not fully capture internal condition, quality of alterations, outlook, land rights or the reasons a buyer paid a particular amount.
Small samples also create instability. If only a handful of suitable homes have sold recently, one exceptional transaction can strongly affect the average. In that situation, a sensible assessment may require older sales, a wider geography and a more explicit range.
Avoid turning an estimate into false certainty. Ask which assumptions matter most and what new evidence could change the conclusion.
Translate the evidence into a pricing discussion
If you are selling, ask your agent to explain the likely selling range, the recommended asking price and the plan for reviewing market response. How to set your house asking price covers that decision.
If you are buying, compare the target property with actual alternatives and assess the condition and financial risks separately. A price that seems low relative to a district average can still be high for the specific home.
PMD's Property Intelligence Report can bring together comparable transactions, property information and pricing scenarios. It remains an estimate based on available evidence, not a formal valuation or guaranteed sale price. PMD is a trading name and service of The Ivybridge Collection Ltd, whose registered nature of business is real estate agencies, and we also sell marketing subscriptions to estate agents.
The useful question is not 'What is the average house price here?' It is 'What have buyers paid for homes that compete with this one, and how confidently can we explain the differences?'
Sources
- HM Land Registry, Price Paid Data: Explains the nature and limits of recorded completed sale prices
- HM Land Registry, House Price Index: Provides background on published house price statistics